We are building a large data center system using Kubernetes for various development teams in the same company. To monitor the system activities, we used to rely on Prometheus and Grafana. Recently, we revamped our monitoring system with VictoriaMetrics and its Kubernetes operator + grafana-operator.
This article shows some of the problems we had and how we solved them.
The problems
We had the following problems with our single-node Prometheus deployment:
- Long-term metrics storage
- Prometheus was configured to have only 14 days of metrics because Prometheus is not designed for storing long-term metrics data. We wanted to keep them longer to help our investigation.
- High availability
- As written in Rebooting a LOT of Kubernetes nodes in a declarative way, we reboot all nodes of our Kubernetes cluster periodically (almost weekly). Nevertheless, we need to keep monitoring the system even during the rolling reboot of the cluster nodes. However, Prometheus is essentially a single node service, so we lost some metrics during the reboot.
- Multi-tenancy
- Our Kubernetes cluster is used by various teams in the same company. Those teams had to deploy their own monitoring system to monitor their own components. We wanted to provide them a more convenient monitoring service.
Alternatives to Prometheus
There are several products that provide long-term storage to Prometheus including Thanos, Cortex, M3DB and VictoriaMetrics. VictoriaMetrics has the following characteristics:
- Simple, compared to its counterparts
- Efficient time-series storage
- Scalable, thanks to well-divided components
- A "drop-in replacement of Prometheus" -- we can keep the same functionality as Prometheus after migration
VictoriaMetrics was first developed as a remote storage of Prometheus. It has added scraping and alert rule components to completely replace Prometheus*1. In addition, a Kubernetes operator for VictoriaMetrics is available.
So we opted to use VictoriaMetrics and its operator.
How the problems were solved by VictoriaMetrics
Long-term metrics storage
Thanks to the great compression ratio of VictoriaMetrics, we can keep metrics data for a little over a year now. VictoriaMetrics has better compression capability than Prometheus, so it uses less storage space.
High availability
VictoriaMetrics has a cluster version to provide horizontally-scalable HA metrics storage by replicating metrics data and distributing read/write requests. We can also configure HA scraping service (vmagent) and alert rule service (vmalert) by simply deploying multiple instances.
Multi-tenancy
Thanks to the operator, tenant teams can install and configure their scraping and alert services by writing simple YAML files. For example, they can deploy necessary components with the following custom resources (The Secret to store configuration for Alertmanager is omitted):
apiVersion: operator.victoriametrics.com/v1beta1
kind: VMAgent
metadata:
  name: vmagent
  namespace: tenant-ns
spec:
  replicaCount: 3
  remoteWrite:
    - url: "http://vminsert-vmcluster-largeset.monitoring.svc:8480/insert/0/prometheus/api/v1/write"
---
apiVersion: operator.victoriametrics.com/v1beta1
kind: VMAlertmanager
metadata:
  name: vmam
  namespace: tenant-ns
spec:
  replicaCount: 3
  configSecret: vmam-config
---
apiVersion: operator.victoriametrics.com/v1beta1
kind: VMAlert
metadata:
  name: vmalert
  namespace: tenant-ns
spec:
  replicaCount: 3
  datasource:
    url: "http://vmselect-vmcluster-largeset.monitoring.svc:8481/select/0/prometheus"
  notifiers:
    - url: "http://vmalertmanager-vmam-0.vmalertmanager-vmam.tenant-ns.svc:9093"
    - url: "http://vmalertmanager-vmam-1.vmalertmanager-vmam.tenant-ns.svc:9093"
    - url: "http://vmalertmanager-vmam-2.vmalertmanager-vmam.tenant-ns.svc:9093"
Although VictoriaMetrics can provide multi-tenancy storage space with its cluster version, we share a single storage space between us and our tenant users. This way, tenant users can combine their metrics with cluster-wide metrics such as those from cAdvisor or kube-state-metrics.
Mutual monitoring
The above VictoriaMetrics deployment depends on Ceph to store data. It makes the storage durable against storage device (= HDD) failures. On the other hand, monitoring might stop in case of Ceph's failure.
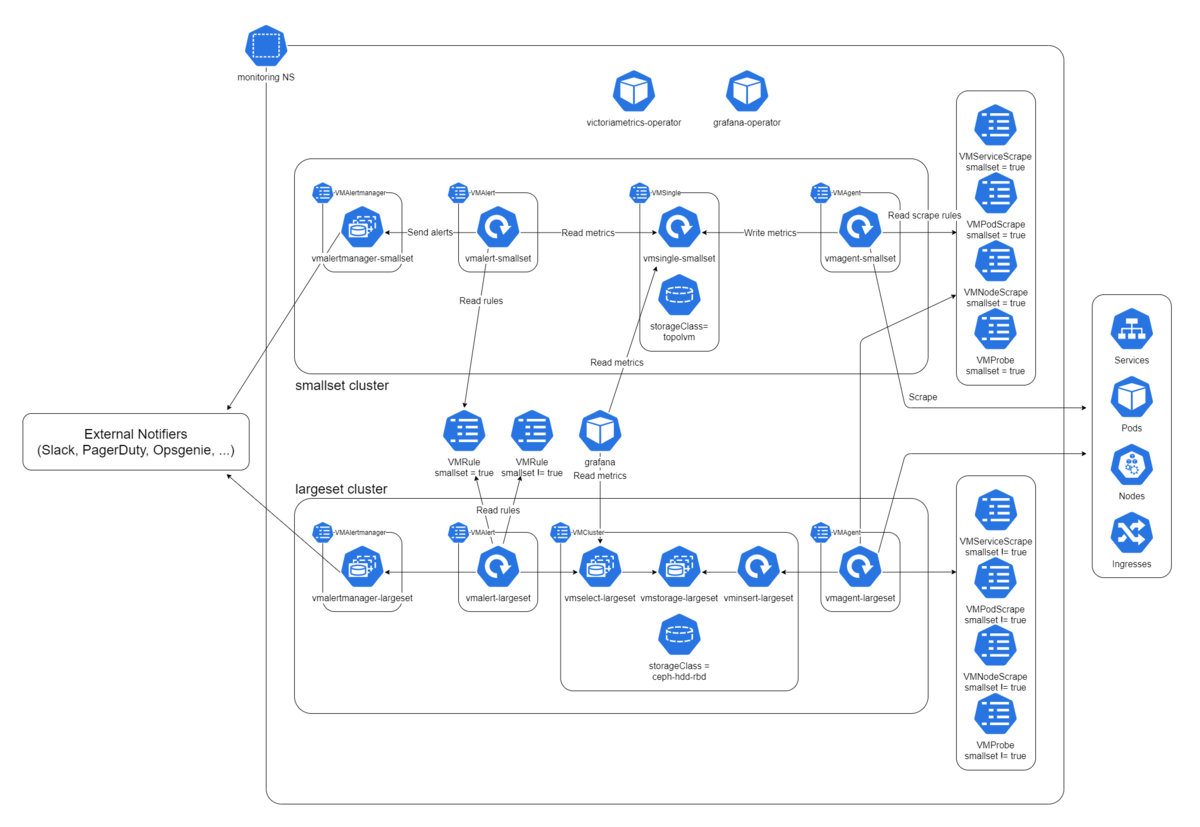
To address this problem, we deployed another set of VictoriaMetrics that does not depend on Ceph. We call the set "smallset" while the above is called "largeset".
Smallset is intended to be used only for monitoring Ceph and the largeset. It uses TopoLVM for data storage and has shorter retention period. The following figure shows the diagram of our monitoring system including these two monitoring clusters.
View original size
Grafana
It is common to use Grafana to visualize metrics. Similar to VictoriaMetrics, we have to achieve multi-tenancy for visualizing. We have been using grafana-operator to allow our tenant users to add dashboards to a shared Grafana instance by creating a custom resource in Kubernetes.
Contributions to VictoriaMetrics operator
VictoriaMetrics/operator is a young product, so you may encounter problems or missing functions. But no worries!
We have contributed fixes and bug reports to the upstream. The upstream team has been so great that they could resolve problems almost instantly. We are incredibly happy with them.
Summary
We showed the configuration of monitoring system by using VictoriaMetrics and its operator. Thanks to its HA, it can fire alerts during cluster failure drill as in the normal case. We hope this article will help guide you to find your way.
*1:Because VictoriaMetrics does not have Alertmanager-replacement, Alertmanager itself is used with VictoriaMetrics.